Multivariate and Advanced Analysis
Factor Analysis (EFA) Assignment Help — KMO, Rotation, and SPSS Steps
What Is Exploratory Factor Analysis and When Do You Use It?
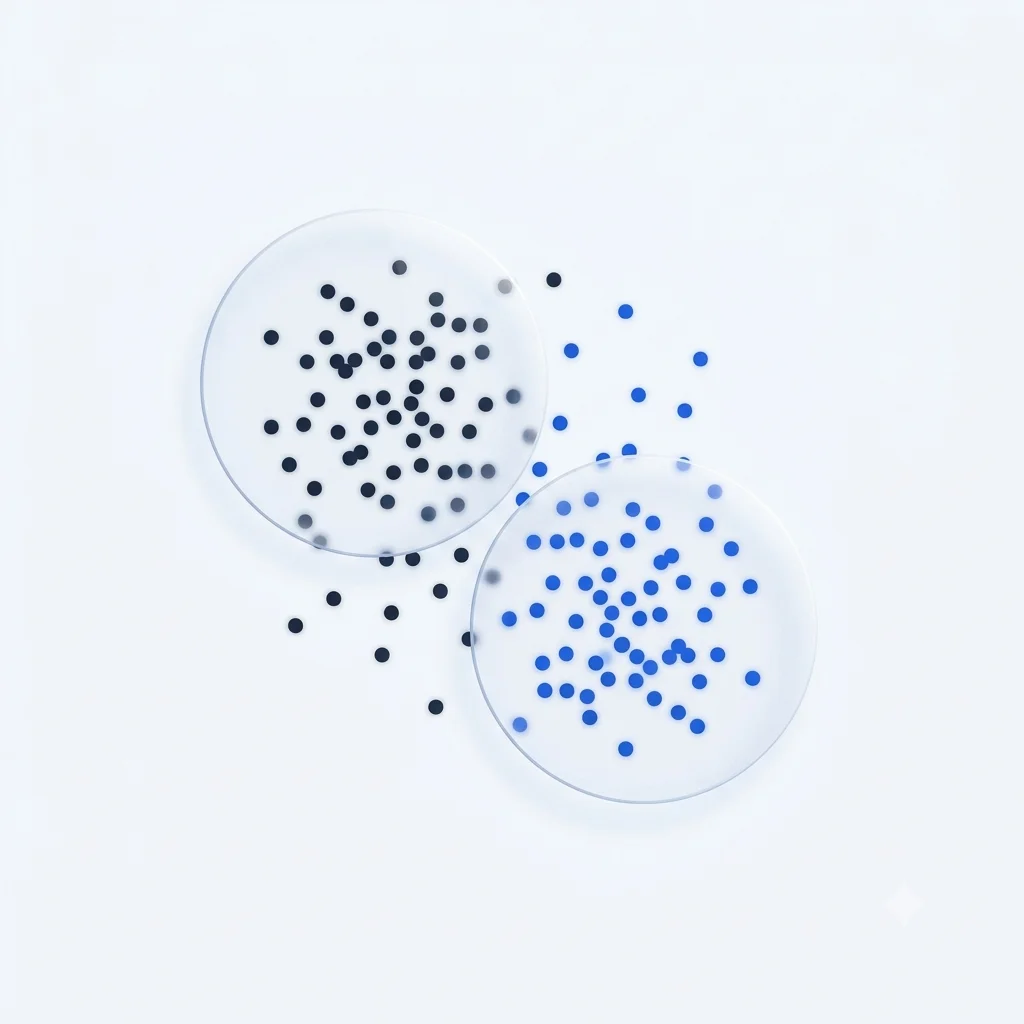
Exploratory factor analysis (EFA) identifies the underlying latent factors behind a set of observed variables, typically items on a questionnaire. It usually comes before reliability analysis in a scale-validation workflow: EFA establishes which items belong together, then reliability analysis tests how consistently each group of items measures its factor.
Assumptions You Must Check Before Running It in SPSS
KMO and Bartlett’s Test of Sphericity
The Kaiser-Meyer-Olkin (KMO) measure checks whether your variables are correlated enough overall to justify factoring: above .60 is acceptable, above .80 is excellent. Bartlett’s Test of Sphericity must be significant (p < .05), confirming your variables aren’t simply unrelated to begin with. Both come from the same SPSS dialog. Request them together.
How to Run Factor Analysis in SPSS (Step by Step)
- Go to Analyze > Dimension Reduction > Factor.
- Move your items into the Variables box.
- Click Descriptives, then tick KMO and Bartlett’s test of sphericity.
- Click Extraction. SPSS defaults to Principal Components, for true EFA, switch the Method to Principal Axis Factoring.
- Click Rotation, then choose Varimax or Promax.
- Click Continue, then OK.
How to Interpret Factor Analysis Output
How Many Factors to Retain: Eigenvalues and the Scree Plot
Kaiser’s criterion (eigenvalues > 1) is the SPSS default, though it’s known to over-extract. Cross-check it against the scree plot’s visual “elbow” point. Parallel analysis is the most defensible modern method but isn’t a built-in SPSS menu option.
Choosing a Rotation Method: Varimax vs Promax
Varimax (orthogonal) keeps factors uncorrelated and is easier to interpret. Promax or Direct Oblimin (oblique) let factors correlate, usually more realistic for psychological and social constructs, which are rarely truly independent of each other.
Reading Factor Loadings and Spotting Cross-Loadings
A loading of at least .40 is generally treated as meaningful. An item that loads above .40 on two or more factors (a “cross-loading”) is a candidate for removal; it isn’t cleanly measuring one construct.
How to Report Factor Analysis Results in APA Format
KMO = .84, indicating adequate sampling adequacy, and Bartlett’s test was significant, χ²(45) = 512.3, p < .001. Principal axis factoring with Varimax rotation revealed a two-factor solution accounting for 58% of total variance.
You’ve Found Your Factors: What Comes Next?
EFA vs PCA vs Reliability Analysis
Principal Component Analysis models total variance for pure data reduction; EFA models shared variance because it assumes real latent constructs sit behind your items: that’s why the extraction method matters. Once your factors are identified, run Cronbach’s alpha on each factor separately to confirm its internal consistency. See the full SPSS statistical test guide for where this fits among the other multivariate tests.
Need this run and reported for your assignment or dissertation? Get SPSS assignment help.
Need this test run for your assignment?
Send us your dataset and research question and we'll take it from here — correct test, correct assumptions, correctly reported.
Get SPSS Assignment Help